Wireless level sensor installed on top of a water tank
Everything we monitor

Water tank level monitoring

Water tank level monitoring: a wireless sensor measures the level every 10 minutes and alerts you on WhatsApp before you run out of water or a tank overflows.

Know how much water is left in each tank without climbing up to check. Xpit Connect shows the level of all your tanks in one dashboard and alerts the owner when it drops below the minimum or exceeds the maximum.

What it solves

01

Water level without site visits

A wireless sensor measures each tank’s level every 10 minutes, so nobody has to climb up to check.

02

Alerts before you run out of water

The owner gets a WhatsApp alert when the level drops below the minimum or exceeds the maximum you set.

03

Usage and refilling at a glance

The history shows when the level drops and when each tank is refilled, to plan supply.

A sensor chosen for each tank

The sensor is chosen for the shape, size and access of each tank, and installed without construction work. It is wireless and sends every reading over LoRaWAN to a gateway with its own 4G connection.

  • The sensor is chosen for each tank
  • No construction work or wiring
  • A reading every 10 minutes

Low and high level alerts

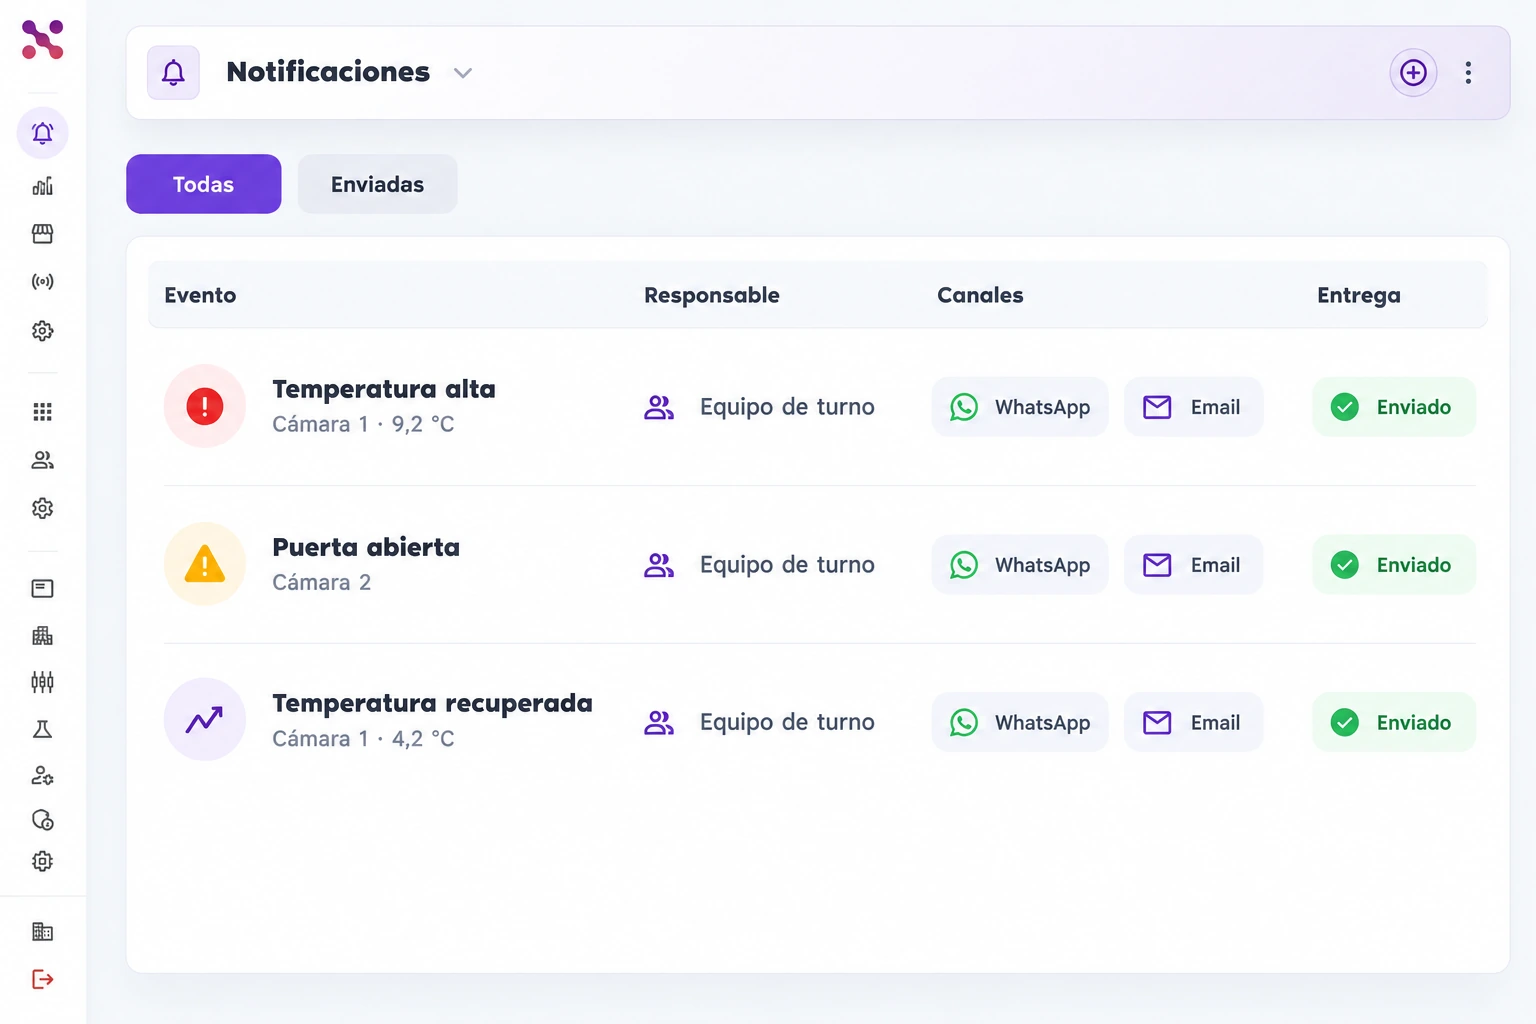
You set a minimum and a maximum for each tank. If the level drops below the minimum or exceeds the maximum, the owner gets the alert on WhatsApp, Slack or email.
  • Minimum and maximum per tank
  • Owners per site or shift
  • History of every alert
Inbox with three temperature and open-door alerts assigned to the shift team, WhatsApp and Email channels, and sent delivery status.
Shift team alerts with delivery channels and status.
Inbox with three temperature and open-door alerts assigned to the shift team, WhatsApp and Email channels, and sent delivery status.

Scroll the image to explore its details

All your tanks in one dashboard

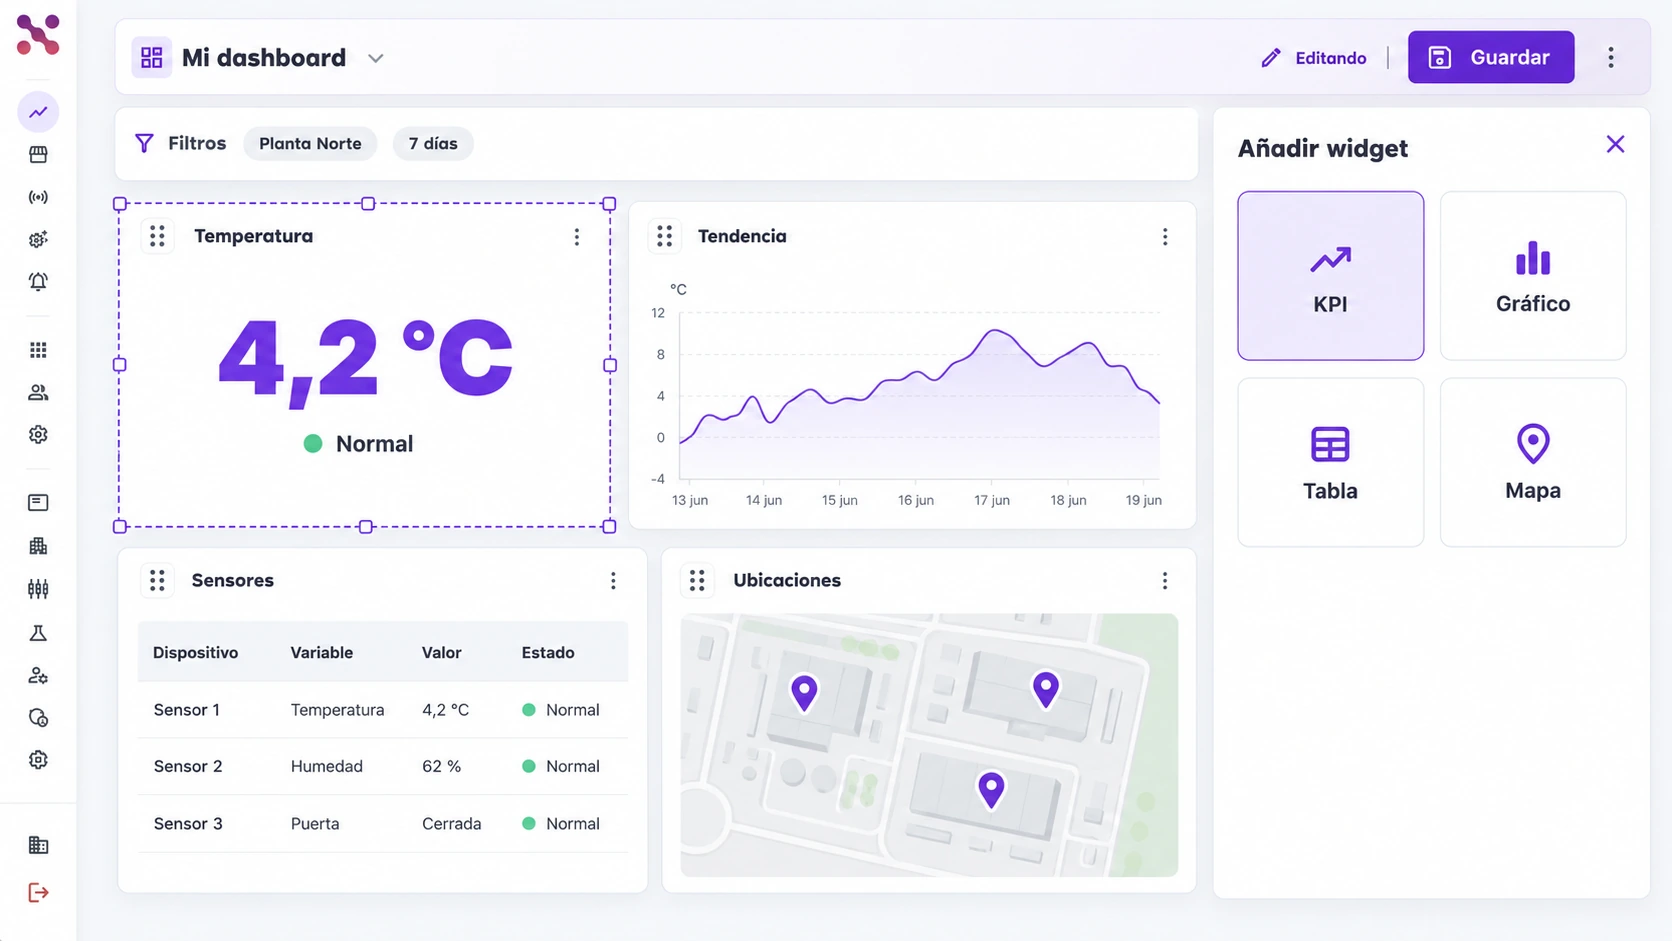
The dashboard shows each tank’s level and history, so you can see usage and plan refilling.
  • View by site and tank
  • Level history
  • Period comparison
Dashboard filtered to Planta Norte and 7 days, with temperature, trend, table, and map widgets; one selected widget has a dashed border and the Add widget panel is open.
Four configurable widgets and a side panel for adding content.
Dashboard filtered to Planta Norte and 7 days, with temperature, trend, table, and map widgets; one selected widget has a dashed border and the Add widget panel is open.

Scroll the image to explore its details

How it works

Real-time data, immediate action

  1. Measure critical field variables with IoT

    • Sensors and gateways by zone
    • Thresholds aligned to your operation
    • Reliable data from the source
  2. Centralize all your information in Xpit Connect

    • Single view by site or equipment
    • Traceable and auditable history
    • Integration with existing sources
  3. Create dashboards, automations, and notifications

    • Role-based operational indicators
    • Automatic alerts for deviations
    • Fast actions for the team
FAQ

Your questions, answered

How often is the level measured?

The sensor reports every 10 minutes. You see how the level changes during the day and get an alert when it drops below the minimum or exceeds the maximum you set.

Which sensor do you use?

It depends on each tank. We choose the sensor and mounting point based on its shape, size, access and whether it is elevated or underground, and define it with you when we quote.

Does it work on remote tanks?

Yes. The sensors communicate over LoRaWAN with a gateway that has its own 4G connection, so they work on tanks far from the office or WiFi. Coverage is validated on site.

Take the first step toward a smarter, more automated operation.

Leave us your details and schedule a conversation with our team. We will help you identify monitoring, alerting, and automation opportunities for your business.

Hablemos